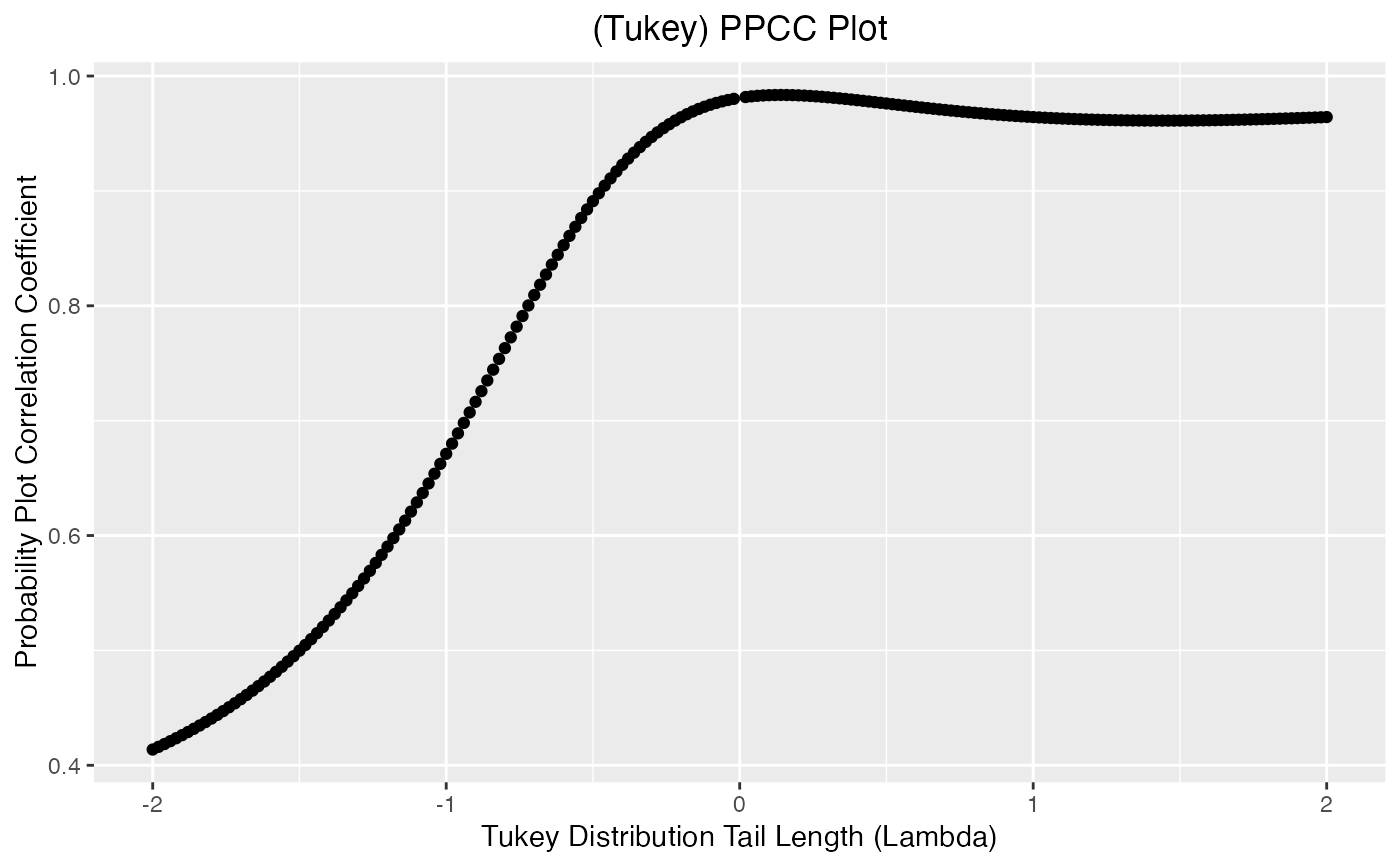
Tukey-Lambda PPCC Plot
tukeyPPCC.RdThe Tukey-Lambda PPCC plot is used to suggest an appropriate distribution for your data.
tukeyPPCC(data)Arguments
- data
A list of data.
Value
The function returns a Tukey Lambda PPCC plot, the maximum value of the correlation coefficient together with the corresponding lambda value and an indication of what kind of distribution your data might fallow.
Details
This function is useful for symmetric distributions. It can indicate what type of distribution your data follows, for example if the data is long-tailed or short-tailed, based on the lambda value, and it can further indicate several common distributions. The Tukey-Lambda PPCC plot is used to suggest an appropriate distribution and you should follow up with PPCC and probability plots of the appropriate alternatives.
Examples
data <- rnorm(100)
tukeyPPCC(data)
#> Maximum value of the correlation coefficient = 0.984
#> Lambda                                       = 0.14
#> The distribution of your data might be aprroximately normal
