Four Plot
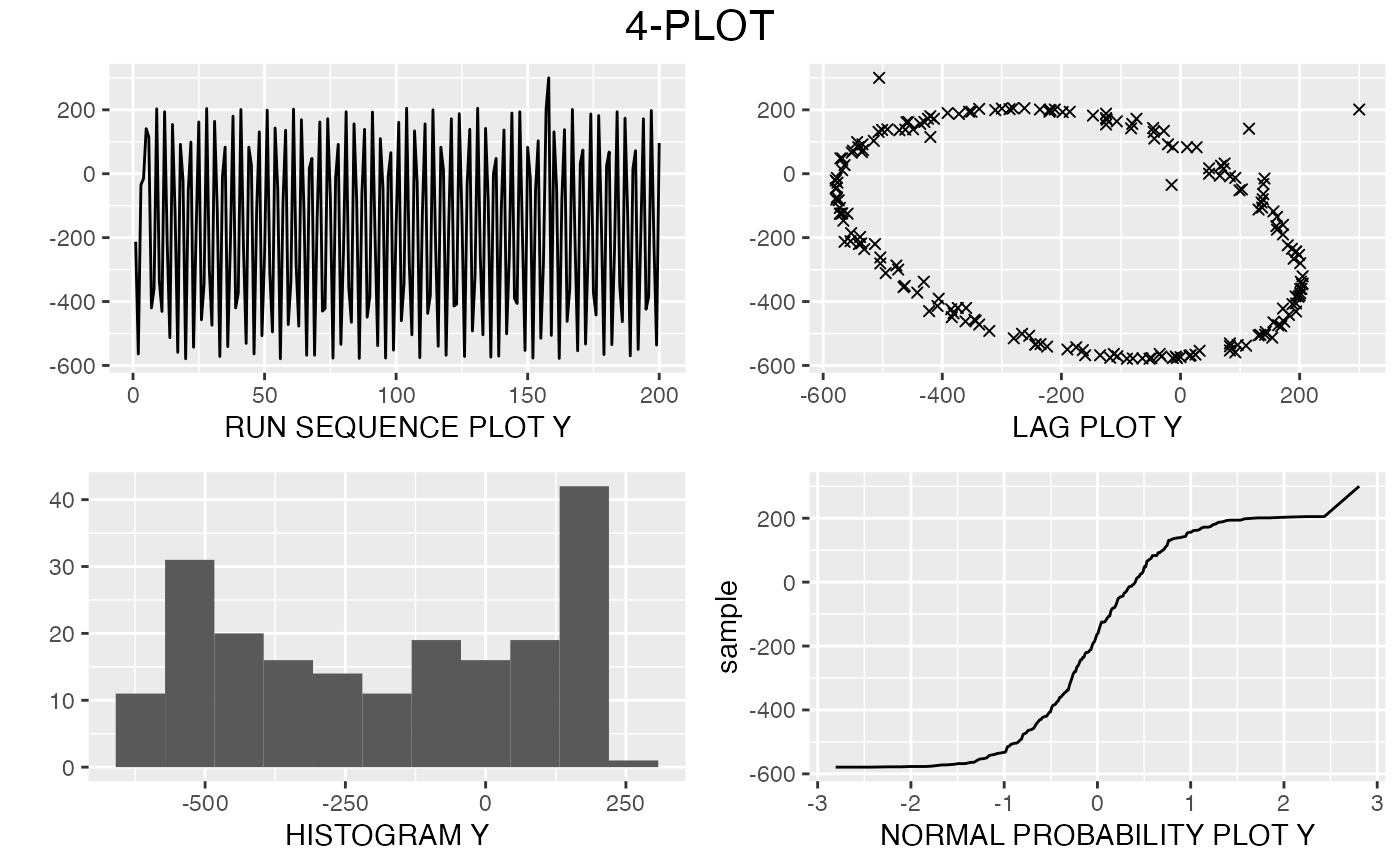
fourPlot.RdThe 4-plot is an EDA technique for testing underlying assumptions. It returns a list of 4 plots;
fourPlot(data, bins=11)Arguments
- data
A list of data values.
- bins
Number of bins to show in the histogram.
Value
A frame with 4 plots.
Details
The 4-plot outputs a frame with four plots.
A run sequence plot to answer the questions of whether or not the data has fixed location and/or fixed variation.
A lag plot that show you whether or not the data is random.
A histogram to test if the data follows a normal distribution.
A normal probability plot that tests together with the histogram, if the data follows a normal distribution.
All plots are made with ggplot2 and can be elaborated further if needed.
The output is a 4plot object, a list containing 4 ggplots. In order seq_plot, lag_plot, hist_plot, quant_plot
seq_plotuses geom_line()lag_plotuses geom_point()hist_plotuses geom_histogram()quant_plotuses geom_qq()
See the vignette for more details about this.
Examples
x <- LEW.DAT$Deflection
fourPlot(x)
