PPCC Plot
PPCC.RdThe PPCC plot is a graphical technique for identifying the shape parameter for a distributional family that best describes the data set.
PPCC(data, distribution = c("weibull", "gamma"))Arguments
- data
A list of data.
- distribution
The distribution that best describes your data written as a string. Right now, you can either write "weibull" or "gamma".
Value
A Probability Plot Correlation Coefficient Plot.
Details
Firstly, you should your data through the tukey_PPCC-function to find an appropriate distribution
for your data. Then the PPCC plot is used first to find a good value of the shape parameter, and lastly
the probability plot (for example, use the function ProbPlot) should then be generated to find estimates of the location and scale parameters
and in addition to provide a graphical assessment of the adequacy of the distributional fit.
You can only use data from either a weibull or gamma distribution, so far.
Examples
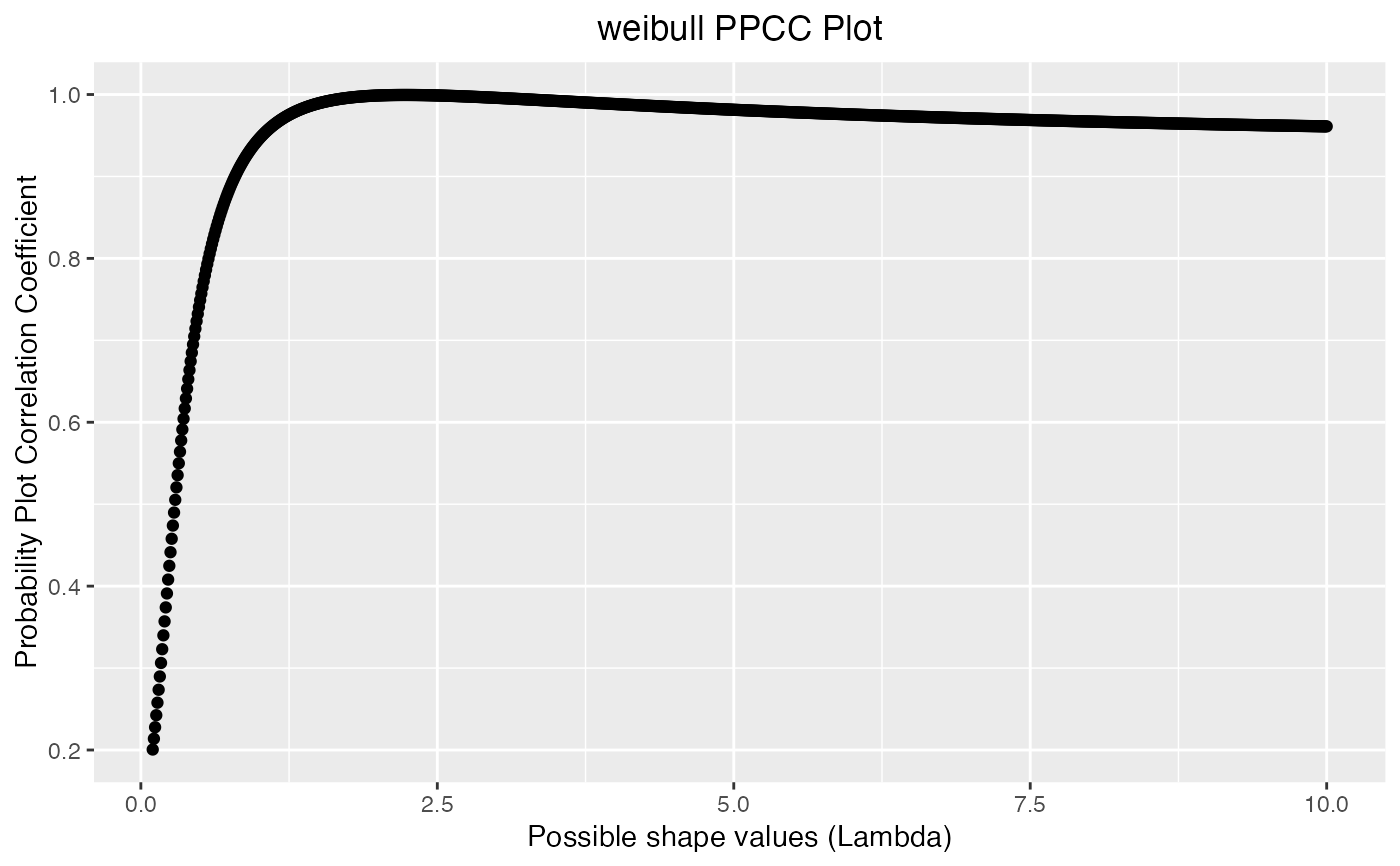
data <- RANDWEIB.DAT$data
PPCC(data, "weibull")
#> Maximum value of the correlation coefficient = 0.999
#> Optimal value of the shape parameter         = 2.23