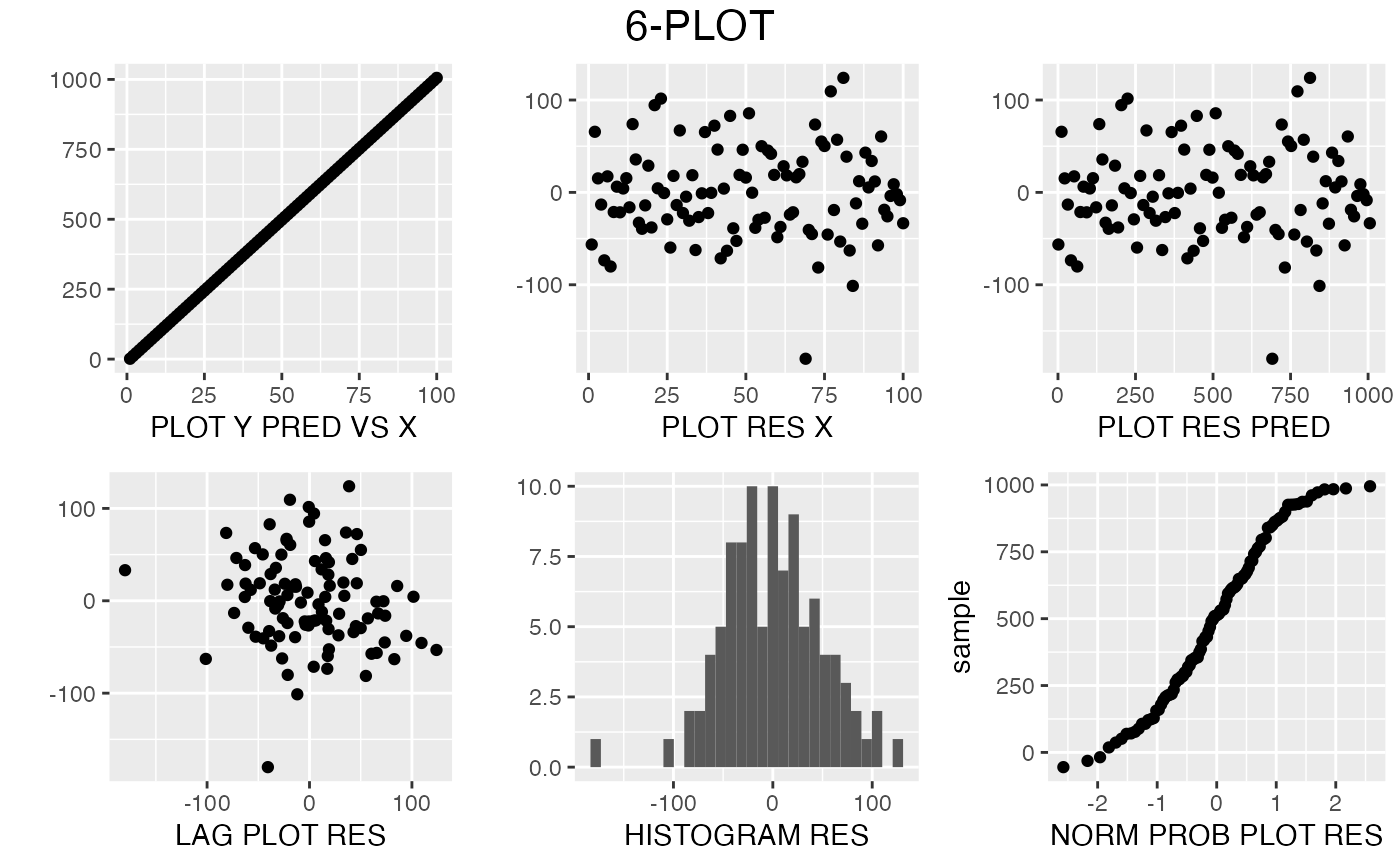
Six Plot
sixPlot.RdThe 6-plot is a collection of 6 specific graphical techniques whose purpose is to assess the validity of a Y versus X fit. It returns a list of 6 plots;
sixPlot(X, Y, bins=30)Arguments
- X
A list of X values.
- Y
A list of Y values.
- bins
Number of bins to show in the histogram.
Value
A frame with 6 plots.
Details
The 6-plot outputs a 6plot object with six plots. A method is provided to print them in a frame. The plots are named scat_plot, res_x_plot, res_pred_plot,lag_res_plot, hist_res_plot and qq_plot. The model is a linear fit.
scat_plotuses geom_point()res_x_plotuses geom_point()res_pred_plotuses geom_point()lag_res_plotuses geom_point()hist_res_plotuses geom_histogram()qq_plotuses geom_qq()
Examples
X <- 1:100
Y <- rnorm(100, X * 10, 50)
sixPlot(X, Y)
